PLAN YOUR OUTBOUND FLIGHT
During this activity you will plan your own research flight from Sacramento, CA to Hawaii and a return flight 2 days later. Follow the steps in the module, making use of the images and forecast maps to help you make your flight plans and follow along with the actual research flights. At the end of the module you will turn in flight plan/weather summaries and mission scientist reports for the outbound and return flights, a total of 4 reports.
It is 2:00 pm on Thursday August 6, 2015. You are a member of the science team with CSET and need to plan a flight for Friday August 7, 2015 (what will become Research Flight #14). To do this, you should consider the forecast trajectories, forecast lower tropospheric stability (LTS), sea surface temperatures, and large scale synoptic pattern.
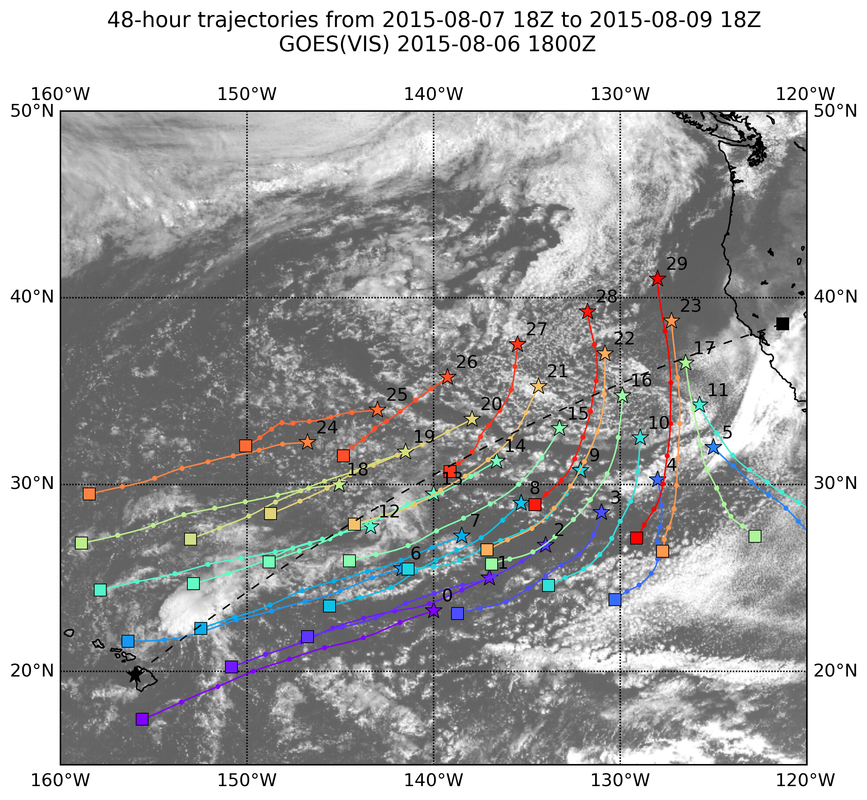
The image below shows forecast trajectories of air starting at 1800 UTC on August 7, 2015 (approx. planned takeover time) and ending 48 hours later. Each line tracks one location, starting at the star and ending at the square, with the dots representing forecast locations of the air every 6 hours along the trajectory. The image also shows cloud conditions at 1800 UTC on August 6, 2015.
(1) To plan your outbound flight, try to locate a path along the stars that takes you across the cloud transition zone as you leave CA and head toward HI.
(2) You want to select a set of points that will be sampled in detail (see in situ sampling Observation Strategies). The maximum length that can be flown in the boundary layer is ~ 1000 nautical miles, so that will limit your path length. You will probably want to limit your BL sampling to about 4 waypoints. The total flight from takeoff to landing should be less than 2200 nautical miles.
(3) You also want to make sure that the return flight 2 days later through the squares is in (close to) a straight line and doesn't exceed the BL flight path from above. Part of planning the outbound flight is making sure that the return flight through the advected air is going to be possible.
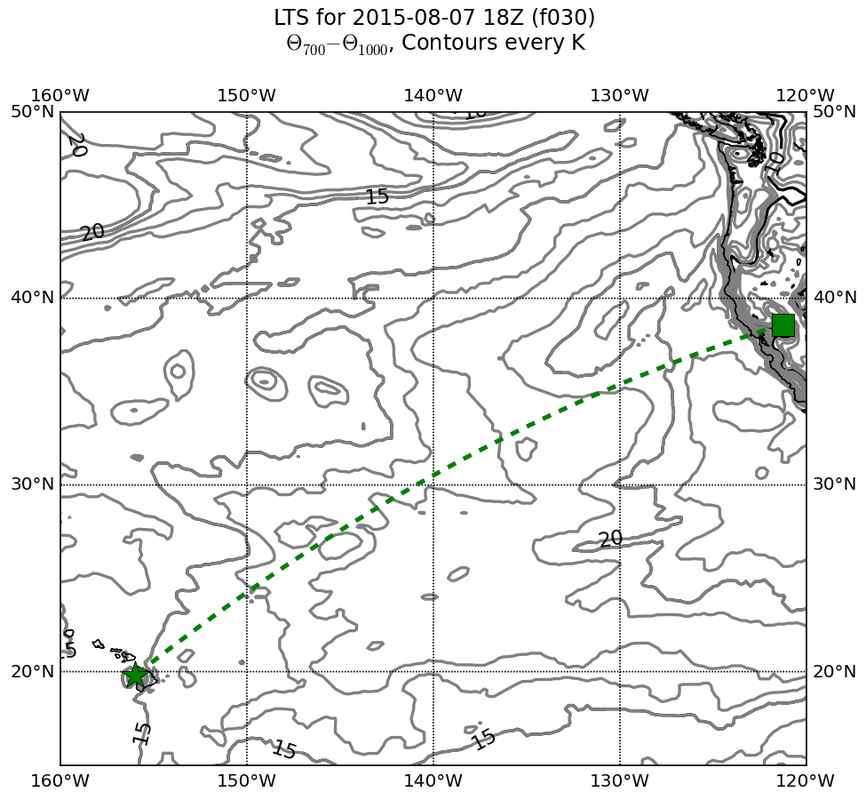
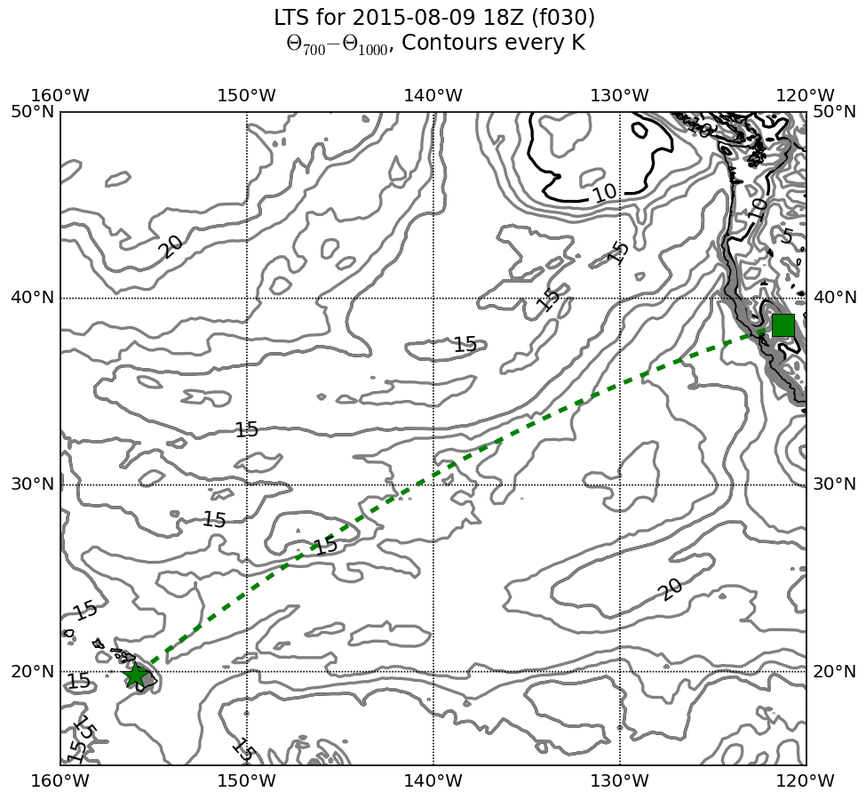
The next image shows forecast lower tropospheric stability (LTS) for the region, defined as the difference in potential temperature between 700 mb and the surface. This will help you adjust your flight path to cross the gradient of LTS and make sure you are sampling the cloud transition zone.
(5) Since one of your goals is to sample areas that will transition from stratus to cumulus during the 2 days between the flights, you can use LTS information to help support or adjust the flight path you planned above. Typically, LTS values between 20-25 K are best for stratus clouds. When the LTS>25 K, the lower atmosphere is often too stable and no clouds form. When LTS is less than ~15 K, the atmosphere is less stable and you will likely find broken and deep cumulus clouds in the unstable atmosphere. (Note that the green dashed line shows the Great Circle route between Sacremento and Hilo).
(5) Since one of your goals is to sample areas that will transition from stratus to cumulus during the 2 days between the flights, you can use LTS information to help support or adjust the flight path you planned above. Typically, LTS values between 20-25 K are best for stratus clouds. When the LTS>25 K, the lower atmosphere is often too stable and no clouds form. When LTS is less than ~15 K, the atmosphere is less stable and you will likely find broken and deep cumulus clouds in the unstable atmosphere. (Note that the green dashed line shows the Great Circle route between Sacremento and Hilo).
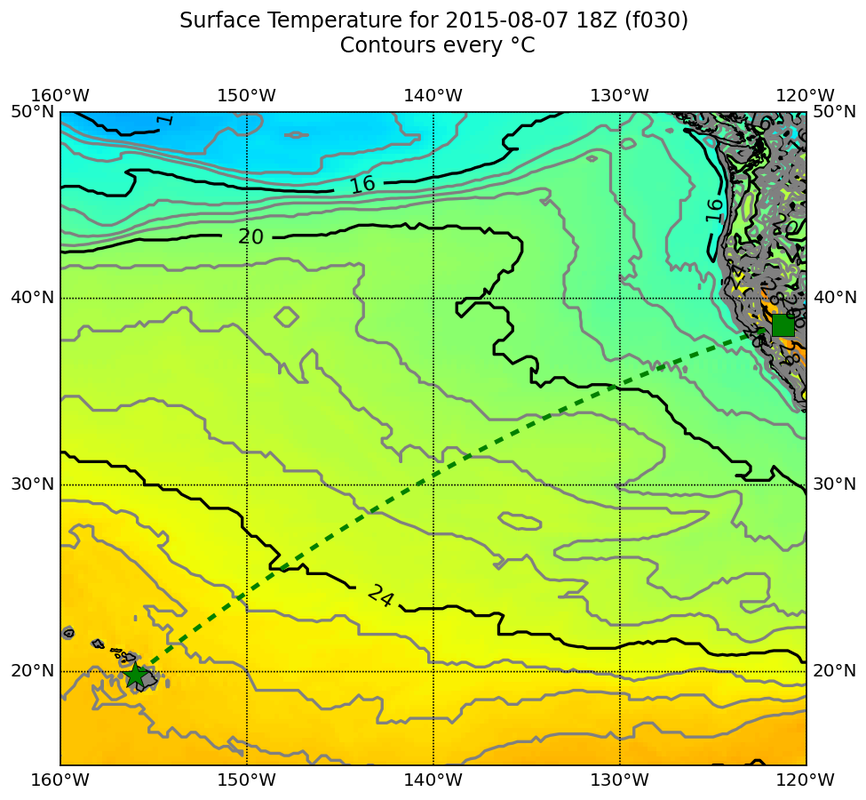
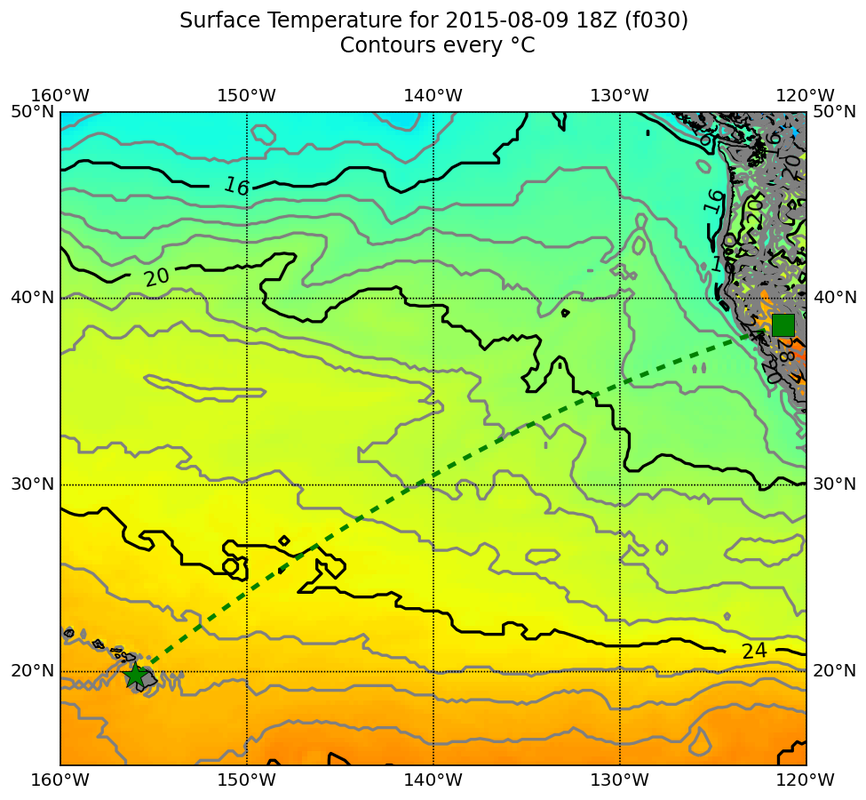
(6) The next image shows forecast sea surface temperature (SST) for the region. You want to make sure that your flight path crosses the gradient of SST as well.
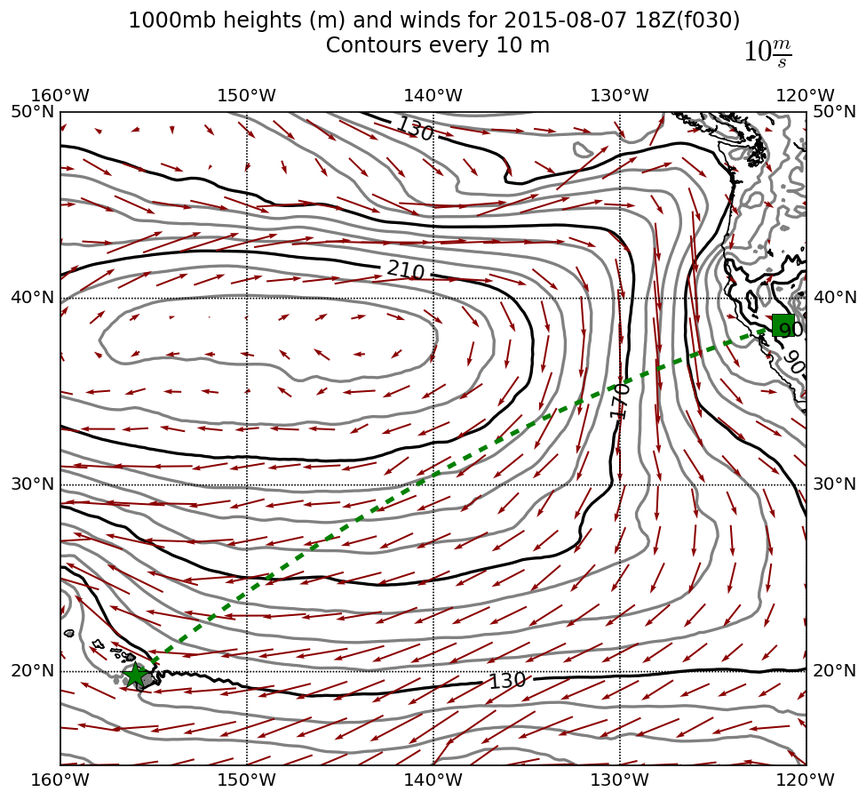
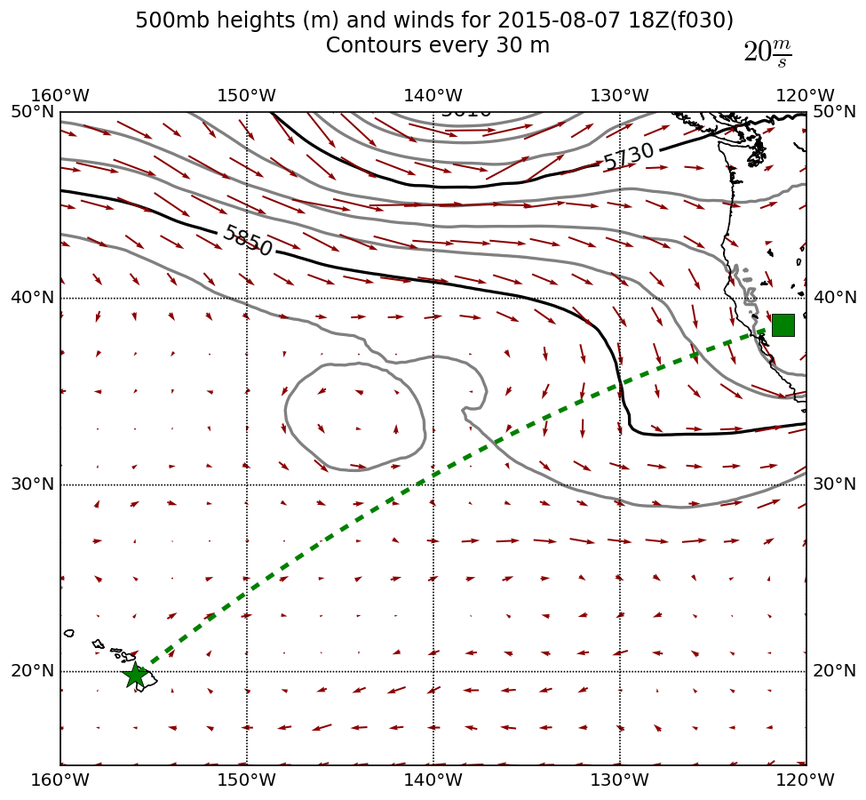
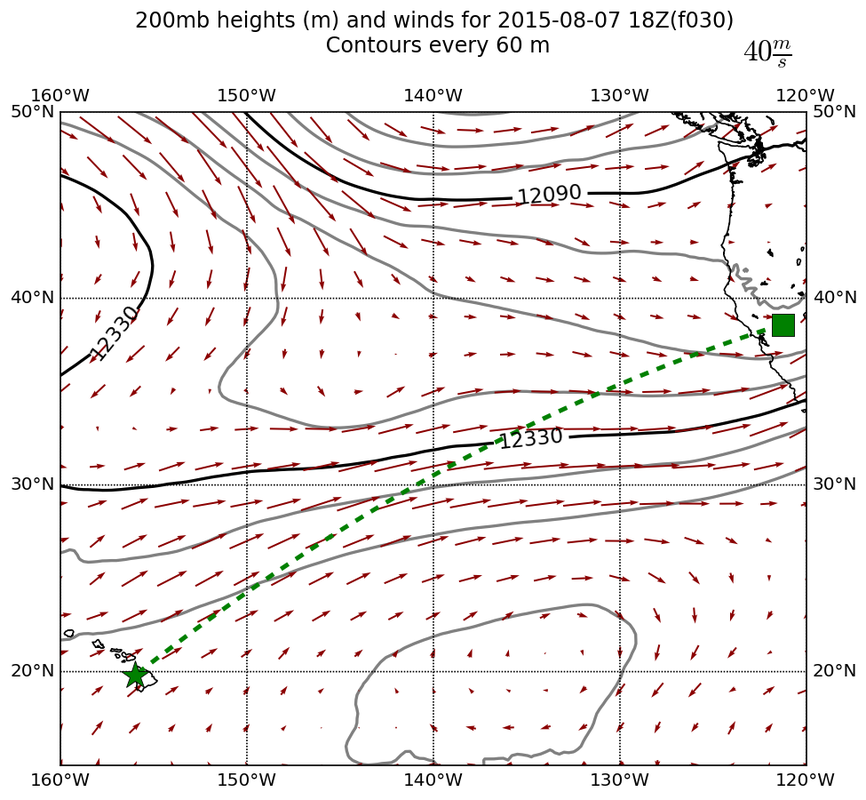
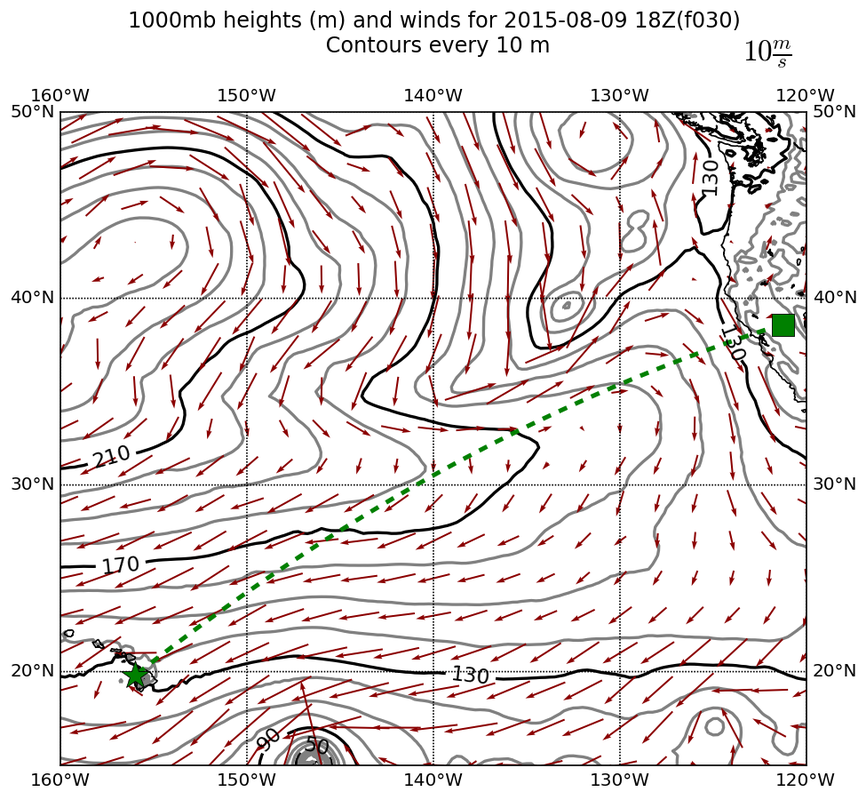
The three images below show forecast pressures at the surface (1000 mb), mid-troposphere (500 mb), and upper troposphere (200 mb) for the expected takeoff time.
(7) From the 1000 mb chart, you can locate the center of the Pacific High and how the winds are blowing around it. Make sure that your planned outbound flight follows the NE trade winds. You can also see the presence of tropical cyclones as intense low pressure systems, so make sure you are not planning to sample in these!
(7) From the 1000 mb chart, you can locate the center of the Pacific High and how the winds are blowing around it. Make sure that your planned outbound flight follows the NE trade winds. You can also see the presence of tropical cyclones as intense low pressure systems, so make sure you are not planning to sample in these!
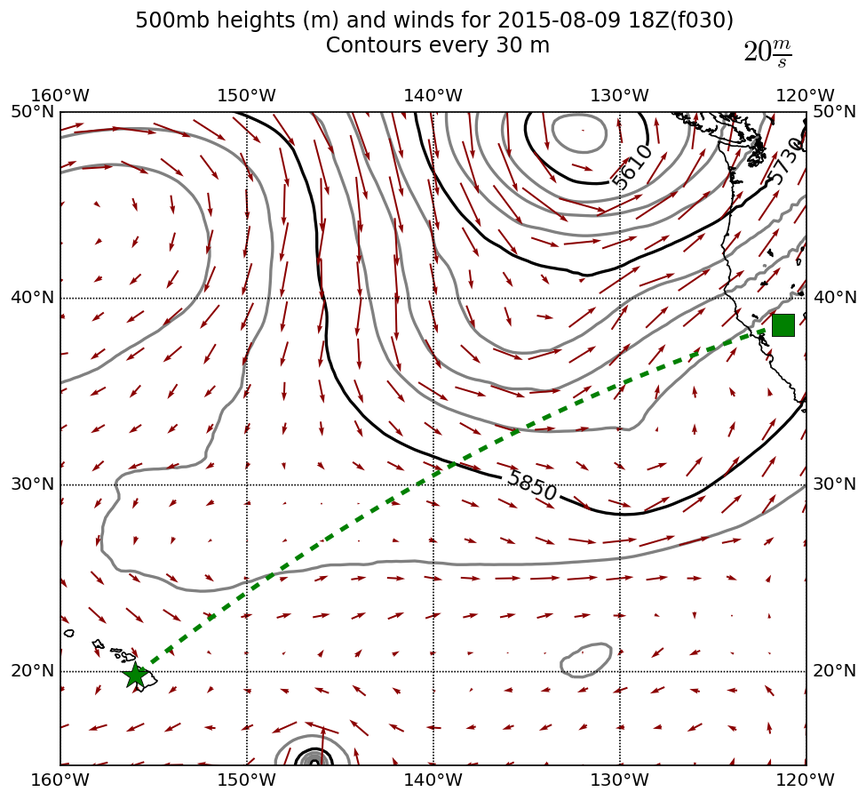
(8) The 500 mb chart typically shows the large-scale steering winds of surface weather systems, along with ridges, troughs and upper-level lows. Often cut-off upper-level lows will deepen the BL and decrease stability. Typically 500 mb is located around 5600 km, so it is up to you to determine how the features seen on this chart will potentially affect your planned flight.
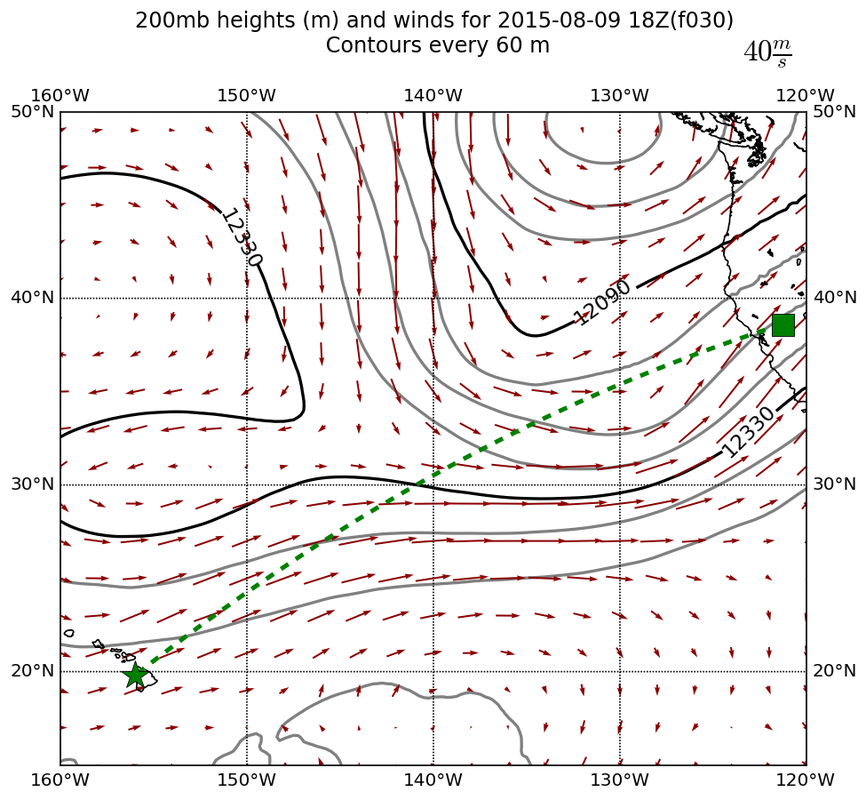
(9) The 200-mb chart is mainly used by forecasters to look for the jet stream, the region of swiftly flowing winds at the top of the troposphere. These will likely occur above your planned flight levels, but one other point to consider on this image is the presence of Tropical Upper Tropospheric Troughs, which can be co-located with upper-level lows, and can also interact with potential tropical cyclone formation.
Other forecast images of large-scale synoptic conditions are available at http://catalog.eol.ucar.edu/cset/model/2015/08/06, select your variable from the NCEP GFS FORECAST PRODUCTS drop down menu and then choose the 12:00 UTC forecast time.
(10) FINAL FLIGHT PLAN AND WEATHER SUMMARY, RF 14: Put together your finalized flight plan and explain what flight path of stars you are going to follow. Include a justification for your path based on the weather conditions predicted in the model data above, explaining why your path maximizes appropriate data collection while avoiding unwanted conditions. Your flight plan should be detailed and should include what flight levels you will be flying at and when, the locations (latitude and longitude) of the start and stop of your BL in situ sampling, and where you plan to drop sondes, as well as your distance flown in the BL and the total flight length.
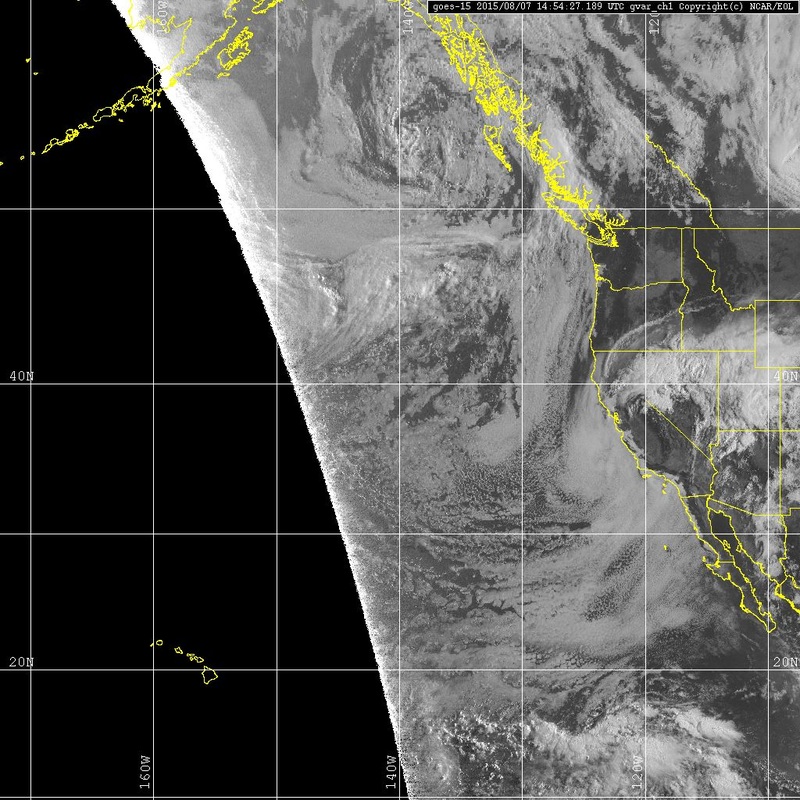
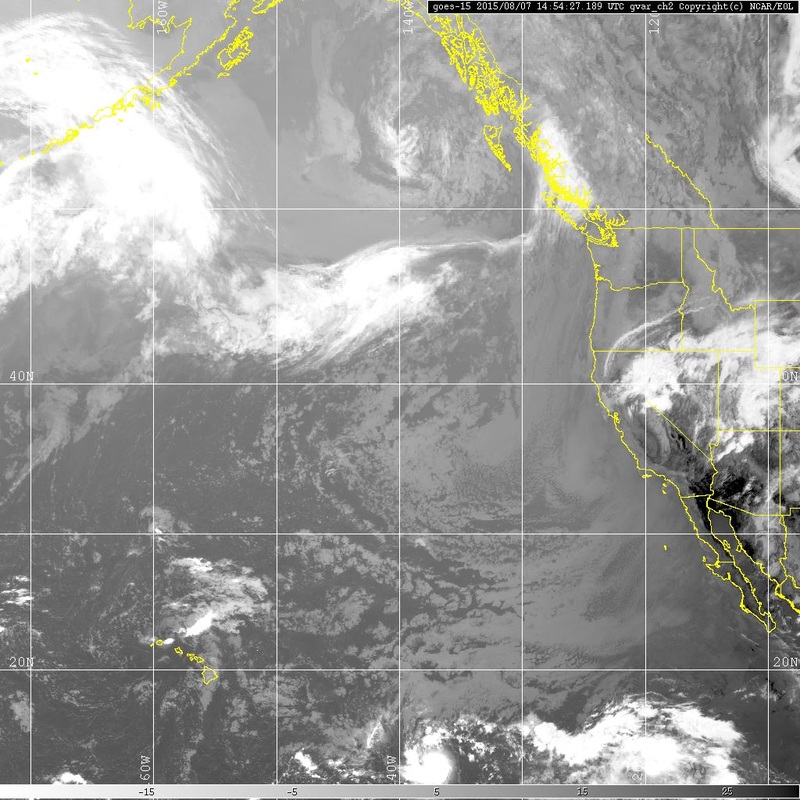
You should also make a statement about whether you would or would not actually take off on the research mission (go/no-go call) based on the visible (left) and IR (right) GOES-15 satellite images at the time of takeoff shown below.
(10) FINAL FLIGHT PLAN AND WEATHER SUMMARY, RF 14: Put together your finalized flight plan and explain what flight path of stars you are going to follow. Include a justification for your path based on the weather conditions predicted in the model data above, explaining why your path maximizes appropriate data collection while avoiding unwanted conditions. Your flight plan should be detailed and should include what flight levels you will be flying at and when, the locations (latitude and longitude) of the start and stop of your BL in situ sampling, and where you plan to drop sondes, as well as your distance flown in the BL and the total flight length.
You should also make a statement about whether you would or would not actually take off on the research mission (go/no-go call) based on the visible (left) and IR (right) GOES-15 satellite images at the time of takeoff shown below.
|
|
FLY ALONG WITH THE OUTBOUND FLIGHT
(11) Using the map function from the field catalog (http://catalog.eol.ucar.edu/maps/cset), select August 7, 2015 at the start of the day in the upper right corner. In the Layer Controls list below the calendar, you will see data that can be toggled on/off by clicking the boxes (hint: you may want to start by selecting GOES-15 Ch2 Image). You will see the data appear on the overview map that you can drag around and resize to view certain regions more closely. You should also play with layering other data on the overview map, including (but not limited to) flight track, dropsonde locations, latitude and longitude lines, cloud top height, and trajectories. You can adjust the opacity of the data on the overview map using the bar under each layering option. You will also see a view out the front of the plane in the upper left corner, also shown in a sped-up video below. Time step through the day (note that the time is in UTC) until you see the plane take off, and then follow along with the flight in small time steps to track what the plane is doing and what conditions they are seeing for your writeup in #12 below. As the plane is flying, you can click on the plane icon for information about the location and elevation of the plane, as well as ambient conditions. You should also make use of a variety of data on the overview map to describe conditions around the plane.
(12) MISSION SCIENCE SUMMARY, RF14: Write up a summary of the actual flight flown by the CSET science mission during RF 14. Include timing of take off, start of BL sampling, timing of flight level changes during BL sampling and conditions observed, timing of end of BL sampling, timing of landing, and locations and timing of dropsondes, as well as any other important observations not mentioned above. If there are large differences between your planned flight and the flight actually flown, hypothesize as to why the flight scientists made the call to fly the flight path they did (the forecast images you used in planning your flight may be helpful here), or why they may not have followed the traditional BL sampling pattern or launched dropsondes.
(12) MISSION SCIENCE SUMMARY, RF14: Write up a summary of the actual flight flown by the CSET science mission during RF 14. Include timing of take off, start of BL sampling, timing of flight level changes during BL sampling and conditions observed, timing of end of BL sampling, timing of landing, and locations and timing of dropsondes, as well as any other important observations not mentioned above. If there are large differences between your planned flight and the flight actually flown, hypothesize as to why the flight scientists made the call to fly the flight path they did (the forecast images you used in planning your flight may be helpful here), or why they may not have followed the traditional BL sampling pattern or launched dropsondes.
You also may find the following sped-up video of the view from the plane during RF14 useful:
PLAN YOUR RETURN FLIGHT
**Note that the return flight is based on the actual mission flown in RF14 (that you described in step 12), not the flight you planned.**
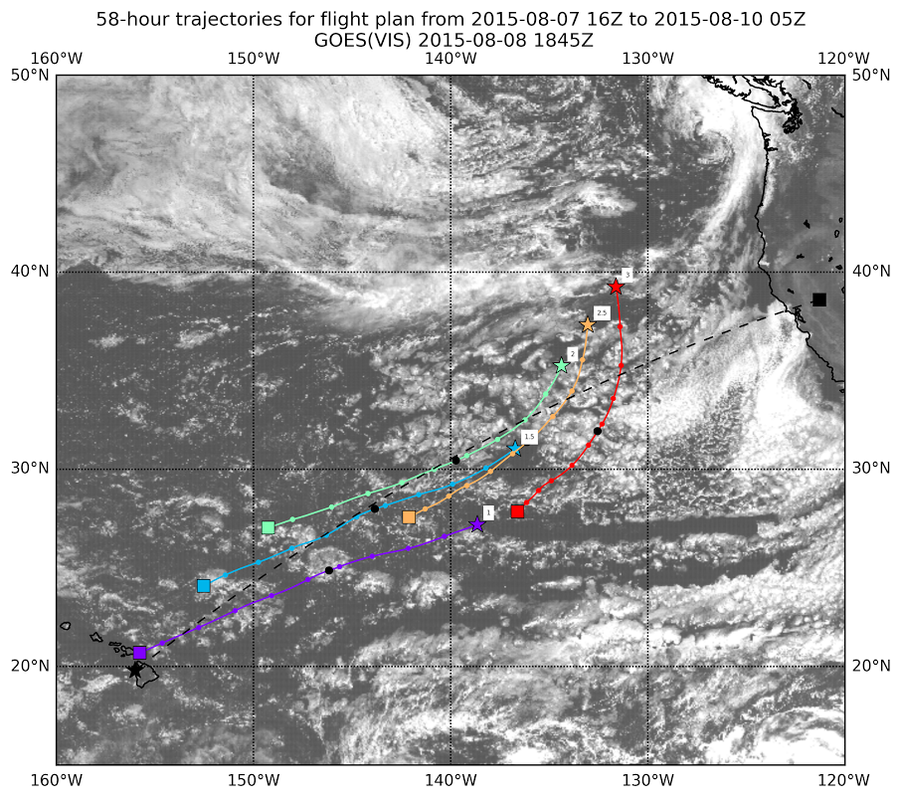
For the return flight, you already have a general idea of where you want to fly, because you want to sample the same air that RF 14 did on the way to CA. The image below shows the actual trajectories of where the points sampled on RF 14 ended up (the waypoints have been renumbered). You want to plan your return flight so that the endpoints of your trajectories will be sampled in detail (in situ sampling). While this should be straitforward, keep in mind that the maximum length that can be flown in the boundary layer is ~ 1000 nautical miles, so that will limit your path length. You may have to make calls about which points not to sample, or decide on your own methods to get the best possible observations without exceeding the BL flight length or overall flight length ( 2200 nm).
For the return flight, you already have a general idea of where you want to fly, because you want to sample the same air that RF 14 did on the way to CA. The image below shows the actual trajectories of where the points sampled on RF 14 ended up (the waypoints have been renumbered). You want to plan your return flight so that the endpoints of your trajectories will be sampled in detail (in situ sampling). While this should be straitforward, keep in mind that the maximum length that can be flown in the boundary layer is ~ 1000 nautical miles, so that will limit your path length. You may have to make calls about which points not to sample, or decide on your own methods to get the best possible observations without exceeding the BL flight length or overall flight length ( 2200 nm).
You may also want to consider LTS, SST, and 1000 mb, 500 mb, and 200 mb forecast images when planning the return flight (images below). For this flight it may not be necessary to sample both cumulus and stratus clouds during the in situ part of the flight, because all of your original waypoints could have transitioned into a trade wind regime.
Other forecast images of large-scale synoptic conditions are available at http://catalog.eol.ucar.edu/cset/model/2015/08/08, select your variable from the NCEP GFS FORECAST PRODUCTS drop down menu and then choose the 12:00 UTC forecast time.
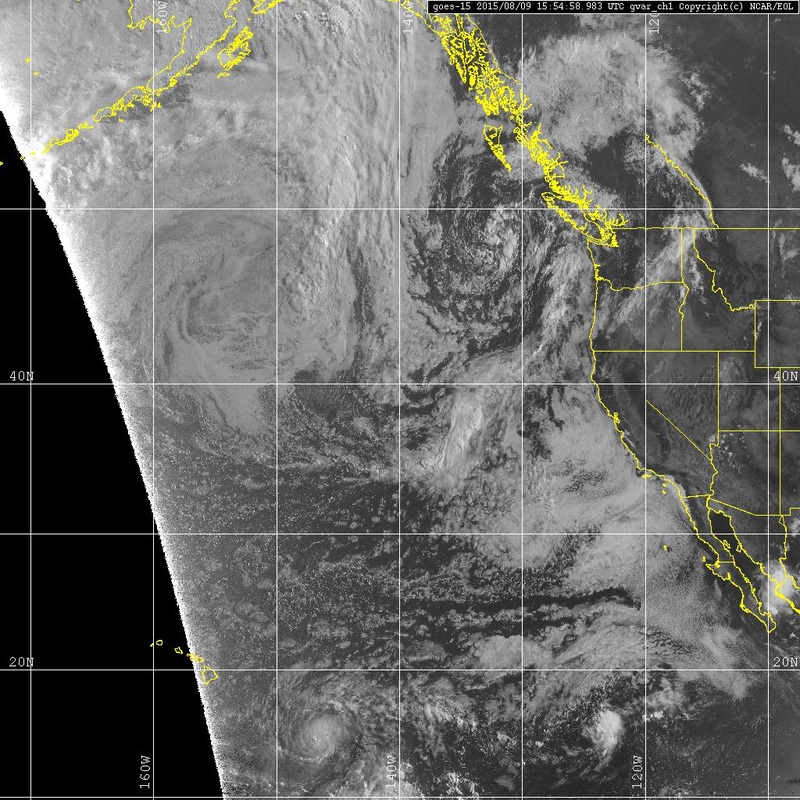
FINAL FLIGHT PLAN AND WEATHER SUMMARY, RF 15: As you did in step 10, put together your finalized return flight plan, including what flight levels you will be flying at and when, the locations of the start and stop of your BL in situ sampling, and where you plan to drop sondes. Write these details up, along with a weather summary of the conditions you saw from the models during your flight planning. You should also make a statement about whether you would or would not actually take off on the research mission (go/no-go call) based on the visible (left) and IR (right) GOES-15 satellite images at the time of takeoff shown below.
FINAL FLIGHT PLAN AND WEATHER SUMMARY, RF 15: As you did in step 10, put together your finalized return flight plan, including what flight levels you will be flying at and when, the locations of the start and stop of your BL in situ sampling, and where you plan to drop sondes. Write these details up, along with a weather summary of the conditions you saw from the models during your flight planning. You should also make a statement about whether you would or would not actually take off on the research mission (go/no-go call) based on the visible (left) and IR (right) GOES-15 satellite images at the time of takeoff shown below.
|
|
FLY ALONG WITH THE RETURN FLIGHT
Again use the map function from the field catalog (http://catalog.eol.ucar.edu/maps/cset), but this time select August 9, 2015 at the start of the day. Time step through the day (note that the time is in UTC) until you see the plane take off, and then follow along with the flight in small time steps. As the plane is flying, you can click on the plane icon for information about the location and elevation of the plane, as well as ambient conditions. Again you can make use of the layering data on the overview map.
MISSION SCIENCE SUMMARY, RF15: Write up a summary of the actual flight flown by the CSET science mission during RF 15. Include timing of take off, start of BL sampling, timing of flight level changes during BL sampling and conditions observed, timing of end of BL sampling, timing of landing, and locations and timing of dropsondes, as well as any other important observations not mentioned above. If there are large differences between your planned flight and the flight actually flown, hypothesize as to why the flight scientists made the call to fly the flight path they did (the forecast images you used in planning your flight may be helpful here), or why they may not have followed the traditional BL sampling pattern or launched dropsondes.
MISSION SCIENCE SUMMARY, RF15: Write up a summary of the actual flight flown by the CSET science mission during RF 15. Include timing of take off, start of BL sampling, timing of flight level changes during BL sampling and conditions observed, timing of end of BL sampling, timing of landing, and locations and timing of dropsondes, as well as any other important observations not mentioned above. If there are large differences between your planned flight and the flight actually flown, hypothesize as to why the flight scientists made the call to fly the flight path they did (the forecast images you used in planning your flight may be helpful here), or why they may not have followed the traditional BL sampling pattern or launched dropsondes.
You also may find the following sped-up video of the view from the plane during RF15 useful:
